
Tech
BI in the Age of AI
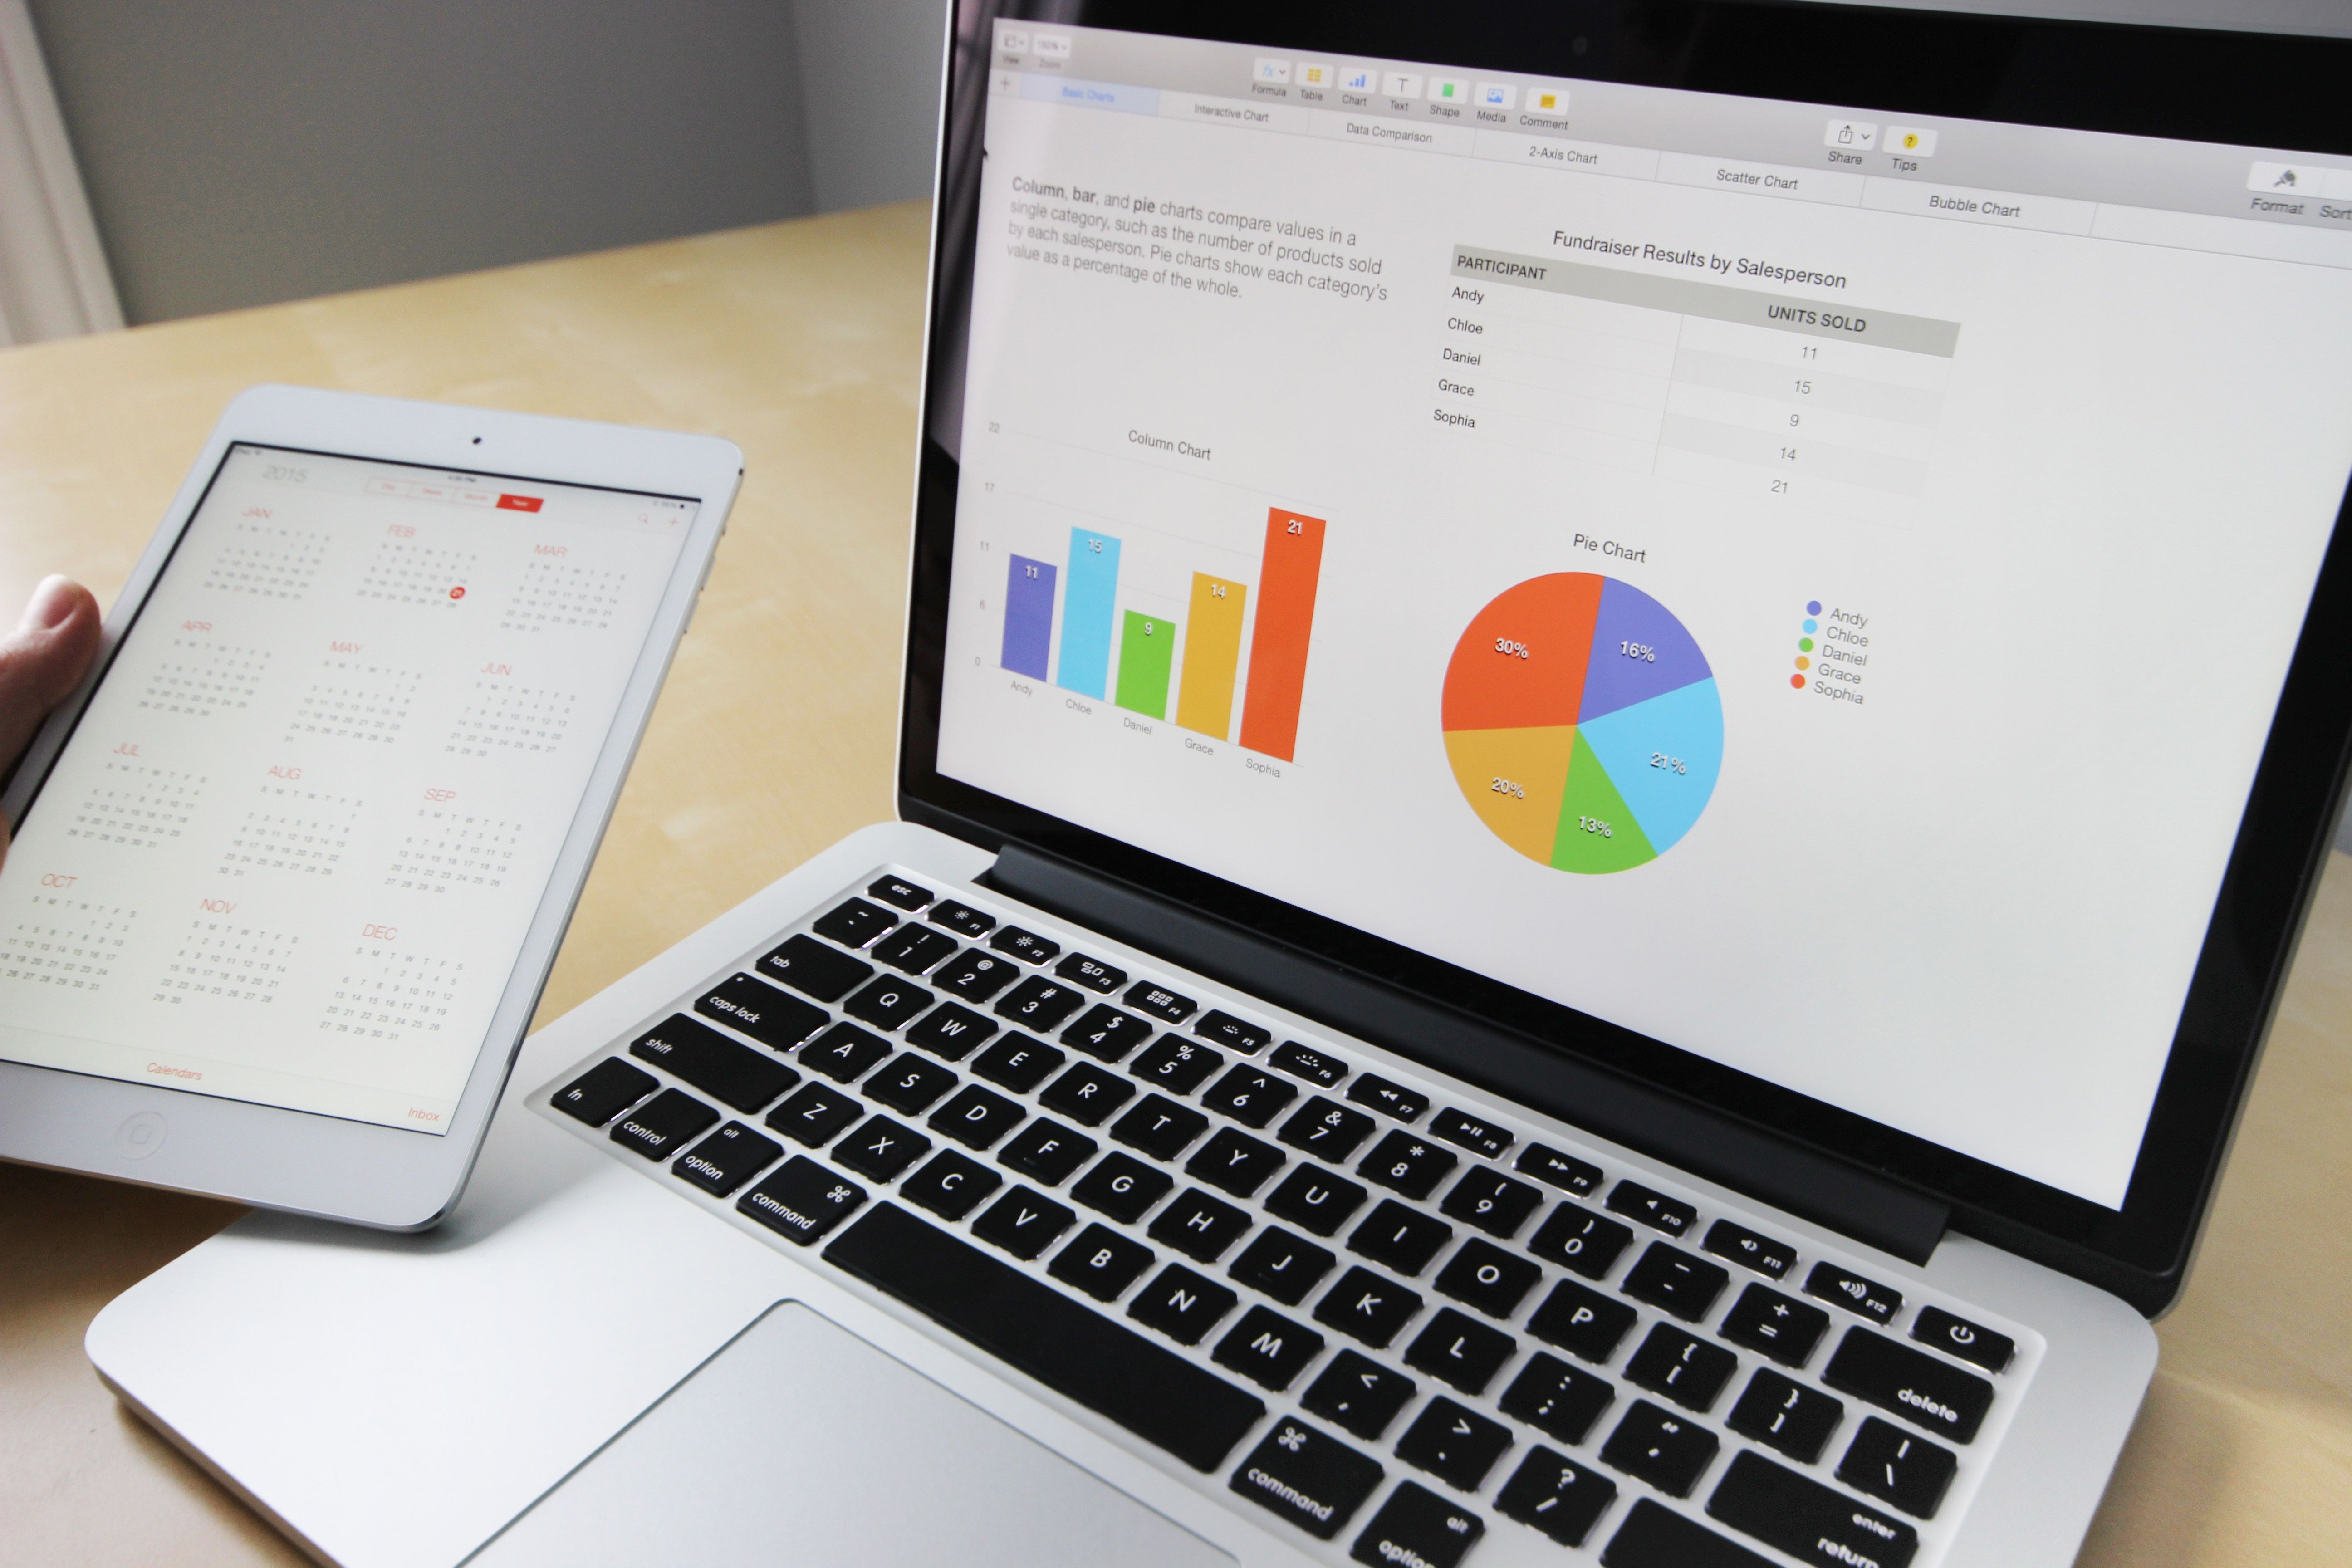
Most organizations we work with use dashboards as the prevailing way to interface with data. We've built plenty of them, in fact. And dashboards are fantastic tools: they help create a shared understanding and ground organizational conversations in data. A well-structured, trusted dashboard is a great starting point for a weekly meeting, or any performance review.
At the same time, dashboards come with limitations. They are designed to answer the most common questions for specified users (e.g. how many vaccinations were performed last week), but edge cases are hard. Specific metrics may not be displayed if they aren't monitored regularly, and ad-hoc questions are difficult to answer without overwhelming users with a confusing filter set. "Self-service analytics" is a term that has been pushed for years, but has hardly been seen in practice.
A dashboard is also limited to providing a static, chart-based picture of what happened. It may tell you a number is down, but it rarely tells you whether to care, why it happened, or what to do about it. That gap is usually filled by a person: the analyst who knows the data, knows the organization, and can translate one into the other, at some cost in time, and always at risk of becoming a bottleneck.
The discipline of building trusted, usable dashboards is called Business Intelligence, or BI. And with the advances in AI, the BI landscape is changing dramatically. What's changing isn't the data or the dashboards themselves; it's the machinery sitting between them and the people who need to act.
The new capabilities
Self-service analytics that actually works
For most data teams, a significant share of time goes to ad-hoc requests: a manager needs to know something, they ask an analyst, the analyst writes a query and sends back an answer. The loop is slow, doesn't scale, and doesn't transfer understanding, just the number.
Agentic analytics changes this. AI agents connected to a well-governed data foundation can interpret a natural-language question, construct the right query, and return an answer without an analyst as the intermediary. "What was our program coverage rate in the northern districts in Q1, compared to the same period last year?" stops being a ticket in someone's inbox and becomes an answer someone can get themselves.
This is the self-service promise BI tools have been making for twenty years, and largely failing to deliver. The difference now is that natural-language querying, grounded in properly defined metrics, actually works well enough to be useful.
Narrative analytics: insight that comes to you
Another significant shift is what's starting to be called narrative analytics: instead of a user going to a dashboard to find insight, the insight is generated and delivered to them in plain language, before they ask.
Think of this common workflow: after reviewing the monthly dashboards, an analyst scans for what's significant, filters the noise, applies their knowledge of the organization to decide what matters, and writes it up for the people making decisions. That process is slow, relies on one person's judgment, and produces a document that reflects one moment in time.
Narrative analytics automates it. An AI that monitors your metrics continuously, detects significant changes, and generates a written briefing (what happened, why, what it means against your targets, what you might do about it) removes the bottleneck and delivers insight to the right person without them having to look for it.
Agents that take action
The third capability goes further still: agents that don't just answer or narrate, but act. Reorder stock when inventory dips below a threshold. Flag a supplier for review when quality scores drop two months running. Trigger a follow-up survey when a program indicator moves outside its expected band. Draft a donor update when the quarterly numbers close.
None of this is science fiction. What makes it viable now is that agents can read from the same governed metrics humans read from, and write into operational systems through the same APIs a human would use. BI stops being a read-only surface and starts being a place to trigger action.
What it takes to get there
As exciting as they are, these capabilities don't come free, and with more power comes more risk. An AI that can query your data, write briefings, and take actions on your behalf can just as easily produce a confident-sounding answer built on the wrong data, a stale target, or a plain hallucination. Unlike a wrong chart in a dashboard, which a familiar analyst would spot and question, a wrong AI narrative lands straight in front of a decision-maker without that context. Trust has to be engineered in.
Two foundations make that possible. The AI needs a reliable understanding of the business context, and a clear set of rules that constrain what it can say and do.
The understanding lives in:
- The semantic layer;
- The rules live in governance and controls.
A documented understanding of the business
What a business measures is called a "metric," and anyone with experience managing a business knows that metrics drift over time and between teams. "Beneficiaries reached" in the program dashboard often doesn't match the number in the donor report, because one counts unique individuals and the other counts service instances. When there is confusion on definitions, a single query run by five analysts produces five answers. It gets worse as more tools, systems, and AI applications all read from the same underlying data.
The fix is a well-organized "semantic layer." Define a metric once (what it means, how it's calculated, whose data it draws from, who owns it) and every downstream application reads from that single definition: dashboards, natural-language queries, automated reports, AI agents. Technology can help in enforcing the definitions, but the necessary precondition is alignment within the business. If your data team isn't yet treating the semantic layer as a strategic investment, everything above becomes much harder to trust.
The metrics are one part of what the AI agents need to know: the context for any analysis or recommendation. A narrative or an agent action is only as good as the understanding of what surrounds the number: the metric definition, the target, the thresholds that matter, and the overall business objective of the initiative.
Codifying that context, a practice called context engineering, is a necessary step: out of individual analysts' heads and encoded into systems the AI can read.
Robust governance and controls
A more powerful AI should not run without controls. Unconstrained agents can display and act on bad data, while also opening new paths for the wrong information to reach the wrong people. An agent asked an innocent-sounding question can surface personally identifiable data from a source the user shouldn't access, or expose confidential metrics across team boundaries a dashboard would have quietly enforced. And once agents can act, wrong numbers produce wrong decisions, executed automatically.
Organizations therefore need clear lineage, versioning of metric definitions, and role-based controls over what each user (and each agent) is allowed to see, ask, and do. Audit trails matter as much for read access as for write actions: knowing who asked what, and what the AI returned, is how mistakes get caught before they compound. Most of this discipline is familiar from software engineering; it's just being applied to data and decisions.
What this means for organizations
With new capabilities in BI, the role of the data analyst changes. Fewer people spending their days translating data into answers; more people building and governing the system that answers on their behalf. That's an upgrade, not a diminishment, but it demands a different skill set, closer to product manager and platform engineer than to report writer.
Metrics start to look like APIs if dashboards, agents, and narratives all consume the same definitions; those definitions have owners, versions, deprecation policies, and consumers. Treating a metric as infrastructure, with the rigor you'd apply to an internal API, becomes the price of admission.
Dashboards themselves don't disappear; they shrink and specialize. Ad-hoc exploration moves into conversation with an agent. Weekly review moves into narrative. What's left for dashboards is what they were always genuinely good for: monitoring a known set of metrics that someone needs to watch continuously, and building alignment so various stakeholders have a trusted reference point. That's a narrower but clearer purpose, and dashboards designed for it tend to be simpler and more effective than the thirty-tab reports currently passing for dashboards in most organizations.
A democratising shift
For all the change, the underlying goal hasn't shifted: put reliable insight in the hands of the people who need it, without requiring them to become data analysts. What's new is that this goal is now genuinely achievable, and not only in organizations with large data teams. A well-designed semantic layer, a bit of context engineering, and access to modern AI models can put self-service analytics, narrative analytics, and even action-taking agents within reach of teams that never had them before.
For our clients, often operating in complex, resource-constrained environments where analytical capacity is limited, and decision-makers are stretched, that's the exciting part. Data-driven decision-making stops being a privilege of the well-resourced, and for the first time, it scales.
Ona Insights works with organizations operating in complex environments to build data systems that last. If you're thinking about what your BI strategy should look like over the next two to three years, we'd be glad to compare notes.